 Community
Social media is a goldmine for brands. They can hollow it out if they want.
Rhetorics aside, using social media in the right way benefits brands.
The visual culture
Here’s an update for all brands out there:
A new trend is slowly taking over the web, having its roots in social media.
The trend is visual communication. Though it’s been in use only for a while now, it has already paved the roads for a culture where graphics, banners, and images dominate communication. The visual culture, according to experts, can be powerful leverage for brands, giving them the much-needed push.
Visual content
The industry’s focus has moved to visual content from text-based content lately. Several factors accounted for this move. One of them is the need to entertain users alongside providing them with new information.
There’s a psychology behind it. The year 2015 saw human attention span shrinking below that of a goldfish. Blogs and other sites that were primarily content-based suffered due to this. Just see the images below and you’ll understand what problems they faced and are still facing:
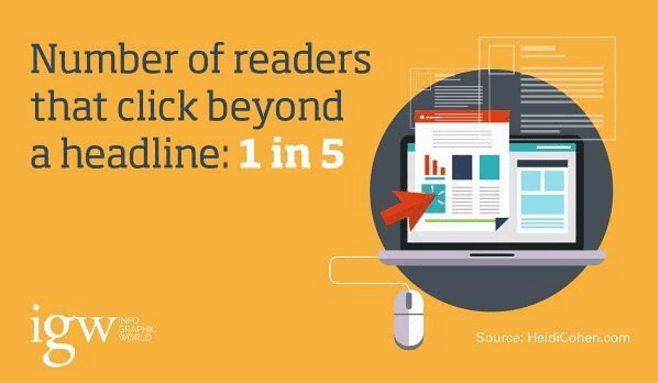
Figure 1
If you think Figure 1 shows you the worst, see the image below:
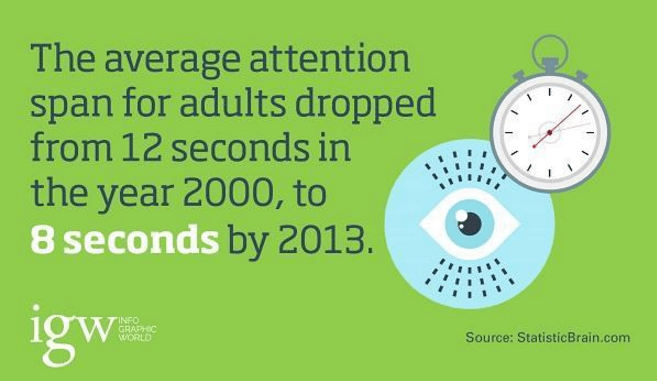
Figure 2
The observation in Figure 2 might create a ruckus among digital marketers because when it comes to online content, the idea is the lengthier, the better. But what’s the point of writing lengthy articles when readers will probably leave the site in less than 8 seconds?
The image below resolves the confusion by answering bloggers why their articles are not getting read:
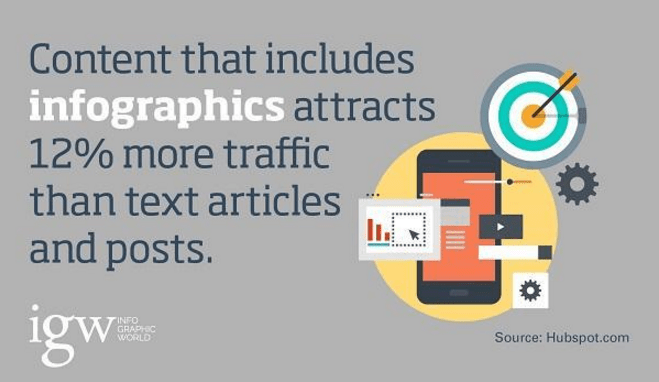
Figure 3
Figure 3 shows the need for visual content. Content-based sites that predominantly relied on text articles alone, lost traffic for obvious reasons.
In short, content marketing techniques will fail to give a brand an edge unless those techniques prioritize visual content.
Social media’s role
Social media gave birth to visual content. Infographics, stock images, skeuomorphic design elements are still popular across social networks for their ability to create engagement.
Some trends have died down in the middle, but during their short lifetime, they proved how visual content can influence user-engagement. One such trend is meme marketing.
Social networks, especially Facebook was bursting with memes once. Meme marketing failed because it became stale after a while. Some brands have seen a reverse effect after they applied memejacking without knowing that it’s a black hat technique. Contemporary marketing techniques center around channels, which are entirely devoted to visual content.
Instagram and Pinterest are two such channels. Both sites rely on user-generated content, get millions of visits every month, and account for better ROI. Pinterest, for example, drove 25% more sales in 2013 than the previous year. Brands that target these two channels work out a marketing strategy that exclusively hinges on graphics and actual photographs.
In short, the majority of brands now understand that social media is pivotal for lead generation and fan engagement. As users on social media love visual content, it’s becoming imperative for them to include such content in their campaigns.
The new wave
Brands need to mull over the new wave of visual content, which has made visual content subject to further experiments, so that something worthwhile comes out, something that users and brands alike will adore.
Real-time infographic is a result of such experiments. Below, you can see one:
Figure 4
(Source)
Figure 4 shows all the changes in real-time that are taking place in the internet. The infographic got an insane number of social shares.
It’s a refreshingly new format that can reshape brand engagement like never before, and promote the growth of visual web. Currently, there aren’t many real-time infographics out there. But hopefully, we’ll see social media is ablaze with them soon.
There’s another equally interesting thing to notice. The new wave falsifies the outdated claim that B2B audiences are different than B2C audiences, and the two groups must be treated differently. Visual content lends brands a hand in bridging the apparent gap between them with the use of
Brand storytelling
A research done by SAP Hybris and Accenture Digital reveals B2B customers are as receptive to personalized treatment as B2C customers, meaning B2B customers love storytelling as much as B2C customers do.
Telling a brand story is not easy. The audiences are not 5-year-olds who’d gather around to listen to a story. They are potential buyers, who’d decide whether they’d buy from the storyteller or move to another vendor. Visual content can make storytelling easy.
Below is the example of how Volkswagen succeeded in doing it:

Figure 5
(Source)
Figure 5 shows the prelude to a story. As fans express interest to know the whole story, they become engaged with the brand. In this example, Volkswagen used an actual photograph of one of its Karmann Ghia Convertible models.
Volkswagen operates in the B2C vertical. Among the B2B brands too, visual storytelling is a game changer. See the image below:

Figure 6
(Source)
In Figure 6, the image on the right side offers a graphical description of an immersive experience. Analysts agree that B2B industry’s future growth depends on the nexus between content and social media marketing. Throwing visual content into the mix makes the nexus more powerful.
All things visual
In the previous paragraphs, we’ve seen how and why visual content is becoming mainstream across the board and why acknowledging it is essential for brands.
Does that mean we are heading to an all-things-visual web?
On the internet, terabytes of content are uploaded everyday, and it’s nearly impossible to figure out how much of it is sponsored content. Stats tell us more than 2.7 million blogs are published each day. Let’s say 30% of those blogs are sponsored. That makes 8.1 million sponsored content each single day.
Keep in mind we are only counting blogs. If we add videos, photographs and front-end elements to the list, the volume of sponsored content will be even bigger. Sponsored content has trust problems. Let’s imagine that all sponsored content on the web will become partly or entirely visual to overcome such problems in future.
That means almost 35-40% of the web content will be visual. Add to that non-sponsored content such as casual videos on YouTube, personal photos on Facebook and Instagram, and stock images tagged with personal blogs, and we have as good as 50% of the content on the web (or maybe even more), visual.
Therefore, we may not be heading to an all-things-visual web but definitely to a many-things-visual web. Interestingly, just as social media’s front-end contributes to the growth of the visualization curve, so does its back-end i.e. analytics obtained from social channels.
Data visualization
Data visualization presents hard-to-decipher analytics figures in a visual format, so decoding them becomes easy.
Fellow writer William Johnson explained back in August how Google Analytics report can optimize landing page experience. In the article, he put dashboard images from Google Analytics. Below is one such image:
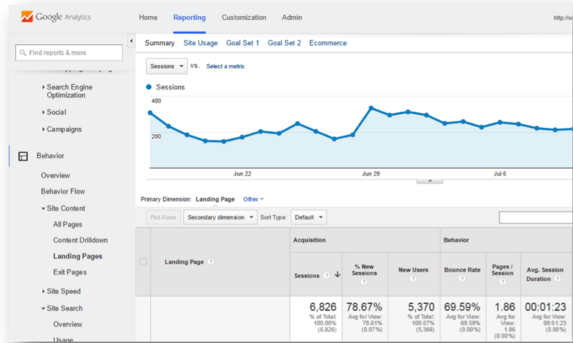
Figure 7
Figure 7 shows a graph and some numbers underneath it. This is not data visualization because if somebody is to understand the relation between the numbers and the graph, he needs to learn how to interpret Google Analytics first.
Data visualization is complete in itself and the onlookers can interpret everything from the visual presentation alone. Something like this:
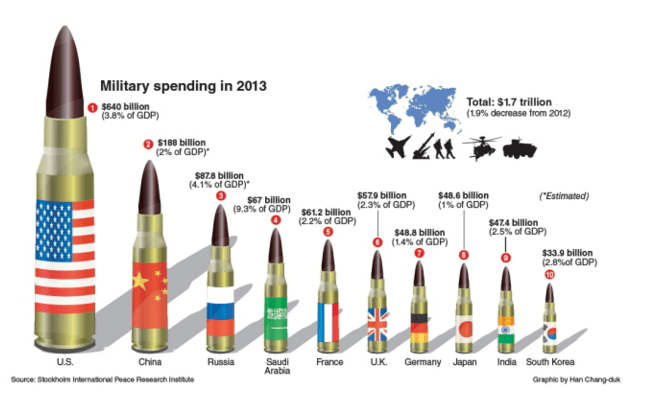
Figure 8
(Source)
Figure 8 ranks countries on the basis of how much they spent on defense budget in 2013. We get all sorts of information from it such as Germany was the 7th country in the world in terms of military spending. We don’t need to learn anything to interpret Figure 8.
Data visualization crosses roads with social media, meaning it has an existence outside the realm of social media. State-of-the-art project management tools are not social networks per se. Those tools render visual details. Below is an example of that:
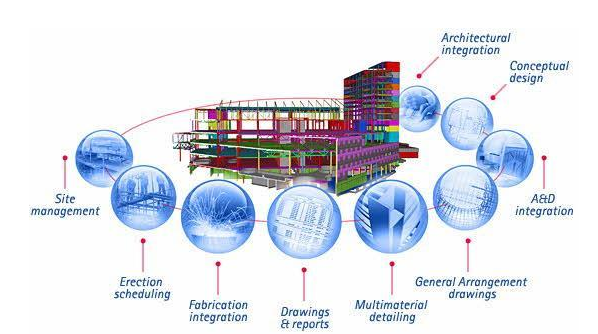
Figure 9
(Source)
Figure 9 shows how BIM addresses various aspects of 3D projects. All crucial data are presented in a visual format, so everyone related to the project can apprehend them.
Experts are of the opinion that the importance of data visualization will skyrocket in the future. Data dug out of social media and collected from outside of social media, mostly business related such as sales progress data, workflow management data, etc will both be visually represented.
Since data visualization is a building block of visual web, and social media’s participation in it is marginal, we can culminate that social media is not the only factor driving the growth of visual web, but a very powerful factor.
Conclusion
It’s time to wind up this lengthy discussion. The visual web has some challenges, which Mark Kelly listed in his article. Apart from the challenges, there are some myths surrounding it, which need to be debunked. Despite the predicaments, however, the visual web is growing, and social media, as we’ve seen in this article, plays a major role in this growth.


Nice information.